As an administrator of several servers hosting a few websites, small as they may be, it is important to me that I can do my best to ensure that the services I am providing are online every second of the day and that I am aware of any issues when they happen. It is also important to me that I can monitor certain things over time and have a visual reference to them. I have four separate tools in my belt for keeping track of my systems and services: UptimeRobot to monitor from the outside; Nagios to monitor from the inside; OpenStatus to provide a quick reference; and Cacti to provide historical data.
Let’s run down each of them, starting with external monitoring. For the last year or more I have used a monitoring service called UptimeRobot. They provide free monitoring for up to 50 services and utilize both email and SMS (via email to SMS gateways) to alert me when something is down. I have monitors set up with them for each of my servers for website, ping, and for a couple of specific services as well.
For what I need, UptimeRobot do a great job. It’s enough to know that my website can or can’t be reached, but that doesn’t give me a lot of detail. Several months ago I implemented a system called OpenStatus. I use this as a public monitoring tool for my services, you can find it here. It gives a regular update of CPU load, memory usage, drive space availability and network usage. I use it regularly for a quick visual reference as to what is happening right now.
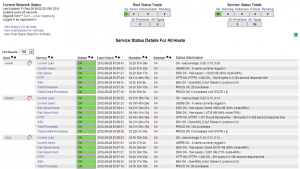
I’m not always at a computer watching OpenStatus, however. In order to get more detail with regard to “right now” and get alerts when things are going wrong, I use Nagios:
Anyone familiar with Linux servers has at least heard of Nagios. It is a very powerful tool for monitoring: it schedules regular checks as defined in the configuration and the checks return “OK,” “Warning” or “Critical.” Again, it’s adjustable by configuration but the default is to check each service every 5 minutes. If the service returns a new status (goes from “OK” to “Warning,” for example) it will recheck a minute later, and if the same status is seen it will send an alert. I use Nagios to monitor more specific details that UptimeRobot can’t, such as disk usage and CPU load. If memory usage gets too high, I get an email. If CPU usage gets to high, I get an email. When they return to normal I also get alerts by email.
These alerts are particularly useful, as they can help me with the warning signs of issues about to happen before I get the terrible text message telling me my site is unavailable.
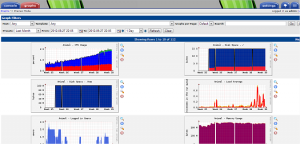
This isn’t the end of my monitoring strategy, however. So far I’ve outlined basic external monitoring for here-and-now, as well as internal monitoring on a finer level. Another aspect to monitoring that is often overlooked (and I consider to be quite important) is looking at trends over time. This is where Cacti comes in:
Cacti focuses on SNMP but it can use anything that returns a numerical value over time and converts those values into graphs. Here you can see the CPU usage is climbing steadily, and it is an issue I will need to look into before it causes problems. You might also notice that over the last couple of days my load averages have spiked a little more, which may be related to the CPU usage problem.
This shows the importance of historical data. I might check CPU usage and notice it’s a little higher than yesterday, but unless I’m noting that down I may not realize that it’s significantly higher today than it was a week or a month ago.
If you are an administrator of anything you consider important, you should be monitoring it somehow. If it goes down, you should at least be aware of it. I am typically made aware of an outage when I get an alert from UptimeRobot to my phone (occasionally I’m monitoring my email and I get Nagios alerts in time for them to help). From there I can check my email to see if there were any warning signs – I have common issues where my web-server will reach it’s RAM limit and start swapping more than my virtual server can handle and Nagios alerts will indicate this. That let’s me know what my next steps should be. Can I log in with SSH and fix the problem? Can I log in to the control panel and reboot the server? Is this a network outage that I just have to wait for? All of these are critical details if I want to maintain an up-time above 99%.


